Management Article -- Technical Analysis of Stock Market
Mr. Kishore Parikh Mr. Prashant Joshi |
“Let us study Technical Analysis of Stock Market”
What is technical analysis ?
The word Technical is derived from Greek word “tekhne”- it means skill or art. Dictionary meaning is – practical skill of a particular subject; it requires specialized knowledge.
The word Analysis is derived from Greek word “analueil” – means unloose. Dictionary meaning is – detailed examination of the elements or structure of something, the subject.
It is defined as a technique to identify the price trend & thereby the price behaviors. The price moves in waves pattern but it does not move in a straight line.
Now how these waves are induced or generated. We can get some insight from natural observations. Nature has some rhythmic and cyclical behavior which occurs at certain time intervals, that is day & night, movements of planets, and life & death.
Mere by observations we find that all these have rhythmic behavior. To identify this behavior (Law) first attempt was made during the time of Columbus by Leonardo da Vinci in his study of the behavior of waves, similar attempt was made by Halley with comet, Bell with sound waves, Edison with electrical waves, Marconi with radio waves, and others have tried with waves of psychology, cosmic waves and television etc.
One common factor in all these waves or these forms of energy have their rhythmic and cyclical behavior. This rhythmic, cyclical behavior is identified by two forces, 1 – Building up forces and 2 – Destructive forces (Tearing Down Forces.)
From these two forces, application of them can be made to price behavior in stock market, stocks, commodity market, bullion market, and currency market. Many have tried to formulate a theory of price behavior in stock market. The most known name is R. N. Elliot, known for his Elliot wave theory. He combined his observations of natural cycles with the knowledge of Fibonacci series. The series is derived by taking No. 2 and adding to it the previous No. in the series, that is 2+1=3, 3+2=5, 5+3=8, etc. The series becomes 2,3,5,8,13,21,34,55,89,144,233, so and so forth. In nature sunflower has 89 curves 55 in one direction and 34 in opposite direction, a piano carries 13 keys, 5 black notes and 8 white notes. Elliot studied 80 years period that the market moved forward in a series of 5 waves and then declined in a series of 3 waves. He concluded that a single long term market cycle carries 8 waves as shown in the figure.
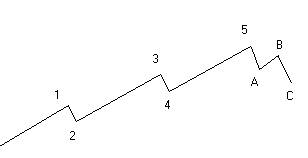
The cycle faces primary, intermediate and short term trends.
A = Primary trend, it last for 1 to 2 yrs.
B = Intermediate trend it last for 3 weeks to 6 weeks.
C = Short term trend it last for 1 to 3 or 4 weeks.
- Now how to determine the trend ?
We use following indicators to determine the trend.
- Moving averages
- Rate of Change (ROC) – Momentum indicator
- Moving average convergence divergence (MACD).
- Time period : for primary trend we use 12 months time series fro intermediate trend we use 6 weeks to 12 weeks and for short term trend we use 10 days 20 days & 30 days time series.
BSE sensex represents sensitivity of the stock market. So we take help of these indicators to measure the sensitivity of the sensex.
- Construction Of Indicators:-
- Moving Average:-
CALCULATION OF AVERAGE. e.g._ 5 Days
Days Total Average
- 20
- 30
- 40
- 50
- 60 200 /5 = 40
MOVING AVERAGE:- 5 D.M.A.
Here we add sixth OBS to total and deduct (subtract) first OBS, then the new total is divided by 5 as we have taken 5 D.M.A.
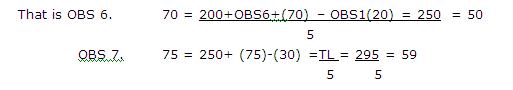
40, 50, 59
- Two Methods are there to generate Buy & Sell signal
A – Intersection of C.P. & M.A. CP should be above M.A.
C.P. Line > or above ® M.A. Line ® Buy
C.P. Line < or below ® M.A. Line ® Sell
B – Intersection of Two Averages:-
Short Term ® 10 Days M.A.
Long Term ® 20 Days M.A.
Buy ® 10 D.M.A. After Intersection with 20 D.M.A. should fall above 20 D.M.A.
Sell ® 10 D.M.A. After Intersection with 20 D.M.A. should fall below 20 D.M.A.
- Show Graph of M.A. only P.C. without Price Line.
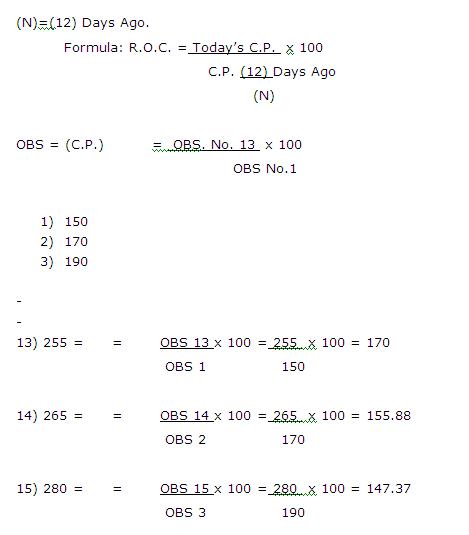
- RATE OF CHANGE (R.O.C.):-
This indicator shows that what % the change in price taken place, to the closing price is changed (%) wise in response to closing price.
OVER BOUGHT & OVER SOLD:-
O.B. ®Value :- Above equilibrium line O.S. ® Value :- Below equilibrium line |
Level depend upon the |
POSITIVE DIVERGENCE ® It occurs below equilibrium line
NEGATIVE DIVERGENCE ® It occurs above equilibrium line
MACD:- MOVING AVERAGE CONVERGENCE & DIVERGENCE :-
- POPULAR TREND FOLLOWING INDICATOR:-
- ULAR TREND FOLLOWING INDICATOR:-
TWO LINES ARE TAKEN
- MACD LINE
- AVERAGE LINE OF MACD
MACD LINE:- DERIVATION OF IT – IT is difference between 12 D.M.A. & 26 D.M.A.
12 D.M.A. & 26 D.M.A.
(Short Term) (Long Term)
AVERAGE LINE OF MACD:- This is derived from the MACD line data, and we take 9 days average MACD line data.
NORMALLY:- This is exponential average.
BUY – MACD line move above average line.
SELL – MACD line move below average line.
- Standard Deviation:-
It is a volatility indicator that is use by analysts to major the volatility of stock. Low value of standard indicates that possibility of a bottom being reached (Low Volatility) and high value of it indicate that a top being formed.
In other words fluctuation is widely scattered above the mean (Average) the value of S.D. is high, and if fluctuation is around mean (Average) the value of S.D. is low.
- Forecasting:-
- Method:-
BSE SENSEX |
High |
Low |
Close |
TTL |
AVE(1) |
AVEx2 |
A(2)- |
AV(2)- |
Weekly |
12303 |
11833 |
12236 |
36372 |
12124 |
24248 |
12415 |
11945 |
Monthly |
11794 |
10645 |
11699 |
34138 |
11379 |
22758 |
12113 |
109643 |
Yearly |
9442 |
6069 |
9397 |
24908 |
8302 |
16605 |
10536 |
7163 |
- Method:-
(1) R.O.C.:- Next Day’s price = Price 12 Day’s ago x today’s value of R.O.C.
(2) M.A.:- Next Day’s price = Price 10 Day’s ago x value of today’s M.A.
By using present value of all these indicators on the basis of daily, weekly and monthly you can forecast future daily, weekly and monthly prices of sensex and stocks.
- Key To Success In The Stock Market With Knowledge And Action
- Perspective: - Always consider the long term implication.
- Objectivity: - Consider 3 or 4 indicators to make buy or sell decision.
- Hear the voice of the market and not the noise.
- Admit your mistakes and don’t repeat them.
- Simplicity: - Most things done well are done simply, because market operates on common sense.
- Concentrate on identifying major turning points.